.png)
Tiledesk Analytics 101
-

- Jovana Ugrinic
 20 July 2022
Analytics section: purpose & whereabouts
In this article you'll learn how to best use our Analytics section, which is divided in three sections:
- Overview
- Number of conversations last 7 days
- Conversations per hour of day
- Median response time & average conversation length
- Metrics
- Conversations
- Visitors
- Messages
- Response time
- Conversation length
- Events
- Satisfaction
- Real Time
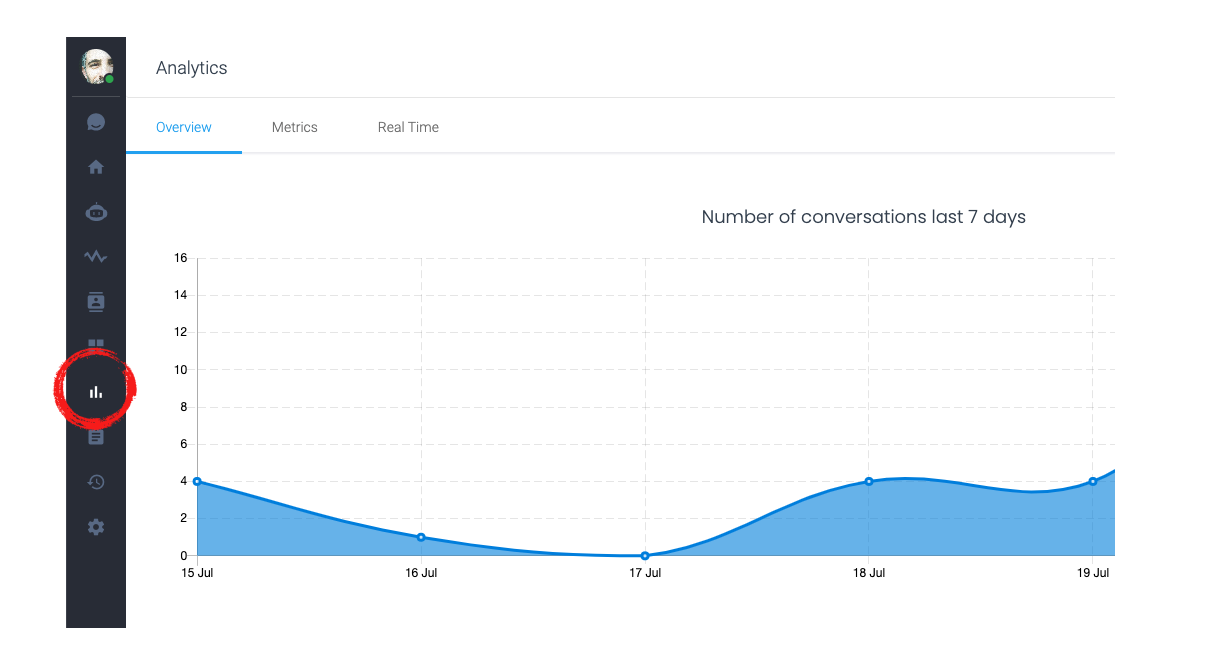
Data Analytics has become increasingly important in the enterprise as a means for analysing and shaping business processes and improving decision-making and business results. Its chief aim is to apply statistical analysis and technologies on data to find trends and solve problems. With Tiledesk, using the Analytics section has never been smoother - you'll find it on the left side of our dashboard menu, as below.
1. Overview
Once there, you'll have three available tabs:
- Overview
- Metrics
- Real Time
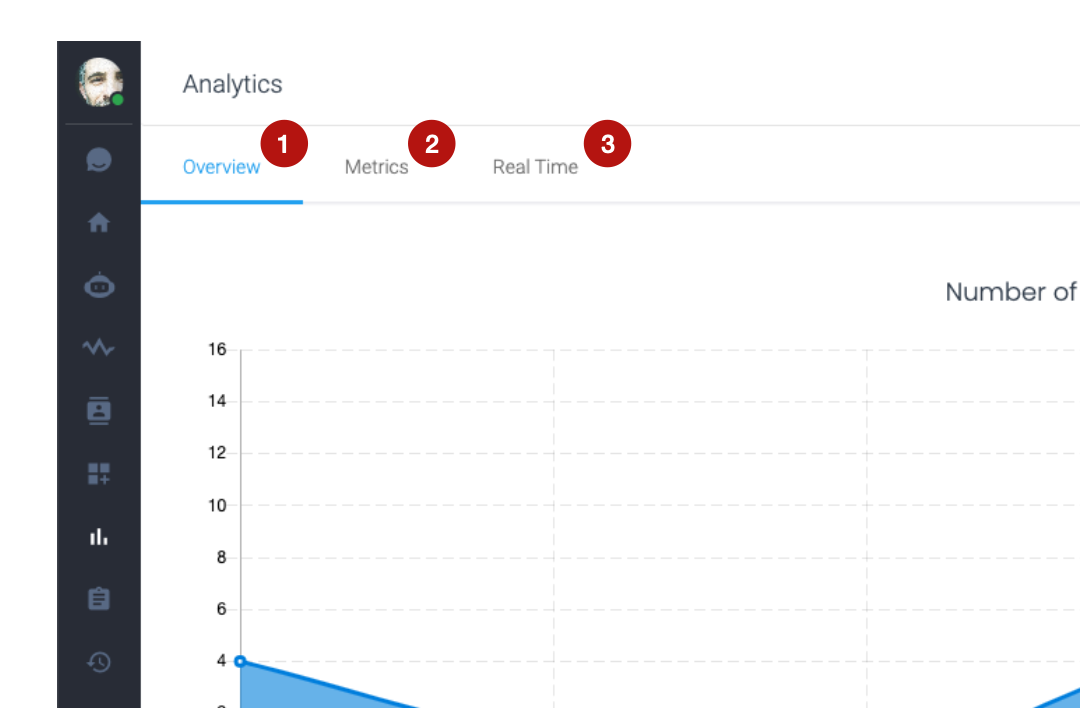
In particular, the Overview section will show a quick summary of all Analytics features through the following sub-sections.
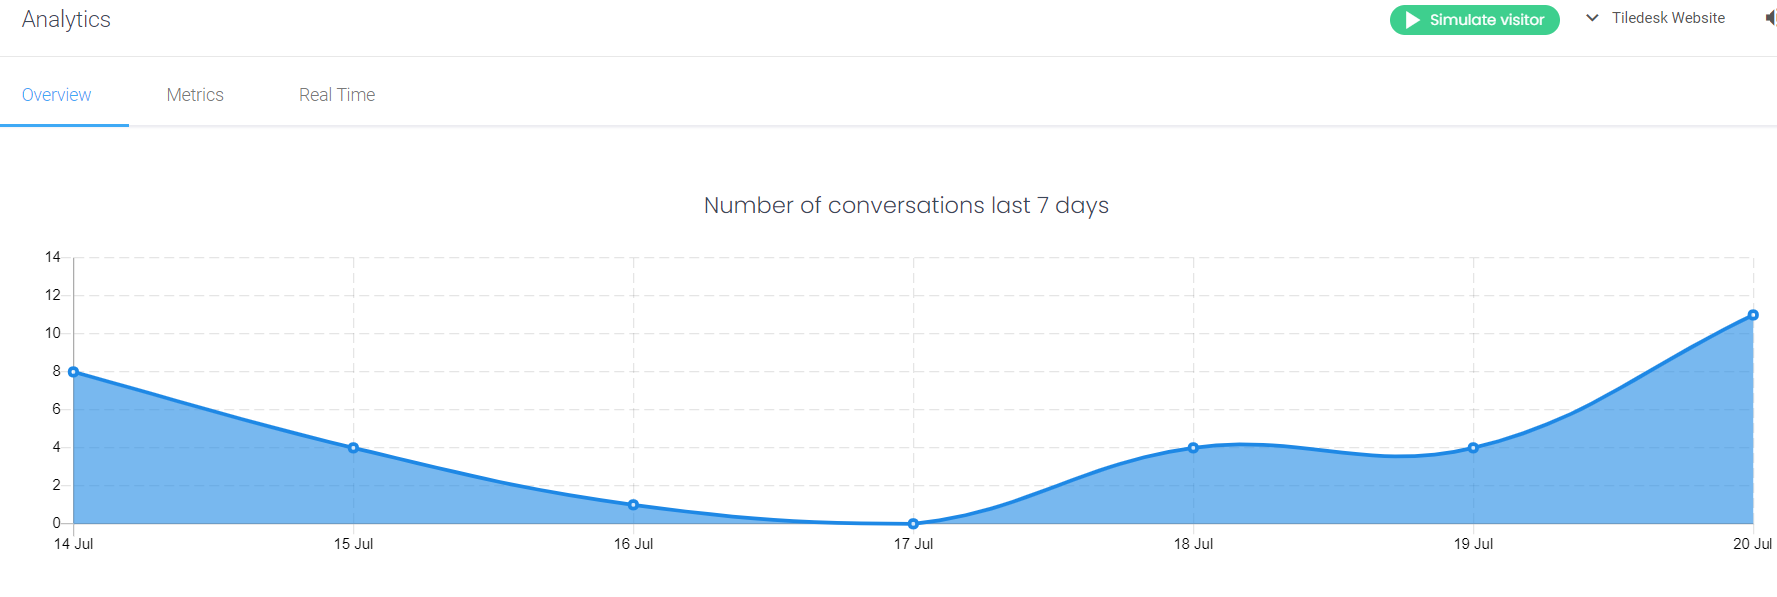
Number of conversations last 7 days. You'll be able to quickly spot a trend and the exact number of client conversations (y-axis) on a specific calendar day (x-axis). In the below picture, you can for example see that during the weekend of 16th-17th July, the number of client conversations was particularly low, as no operators were on duty; whereas, on Tuesday the 20th July, our agents reached a peak of 20 conversations with our users.
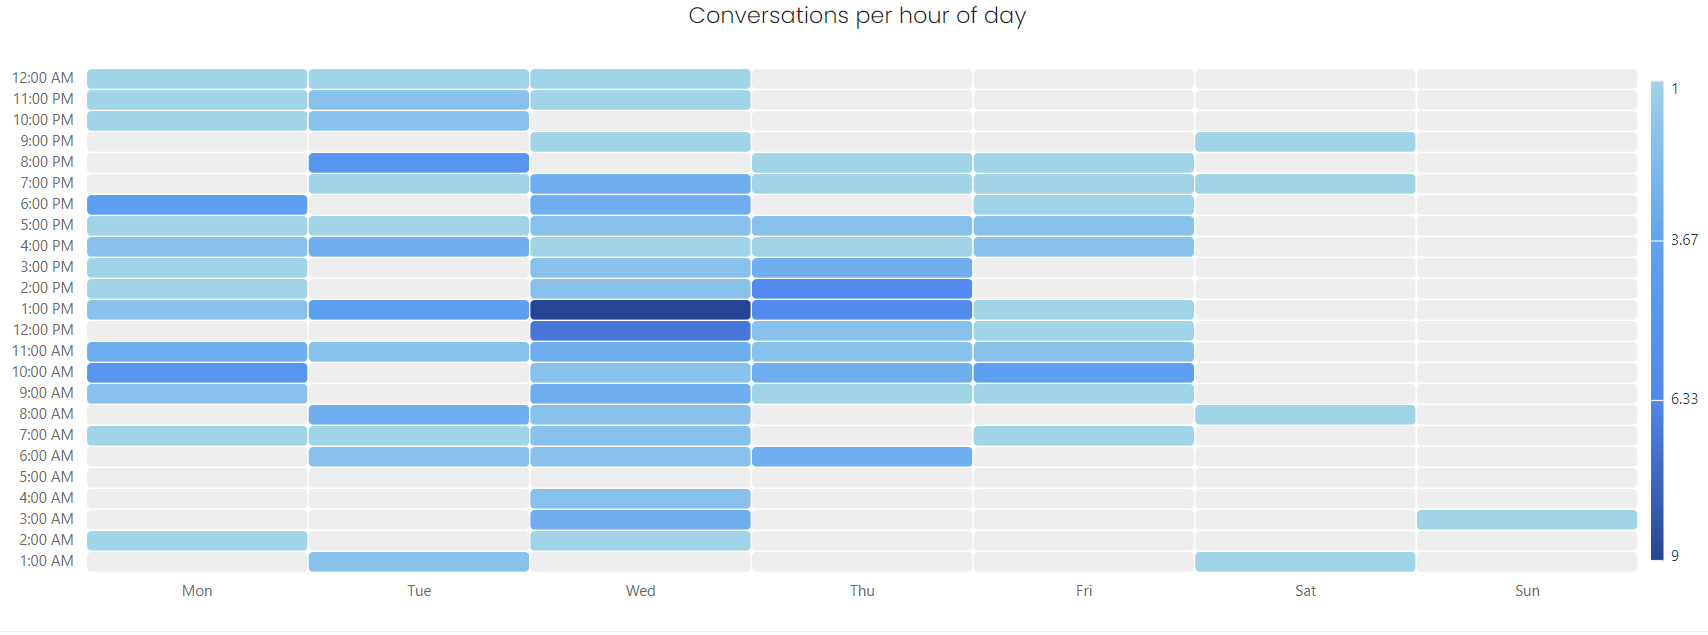
Conversations per hour of day. If you scroll down, you'll find the table that points out what are your busiest hours (identified by dark blue on the y-axis), as well as your not-so-busy hours (light blue) on specific days of the week (x-axis). This can be particularly helpful if you're trying to figure out a rota for your agents based on your average client demand during certain shifts.
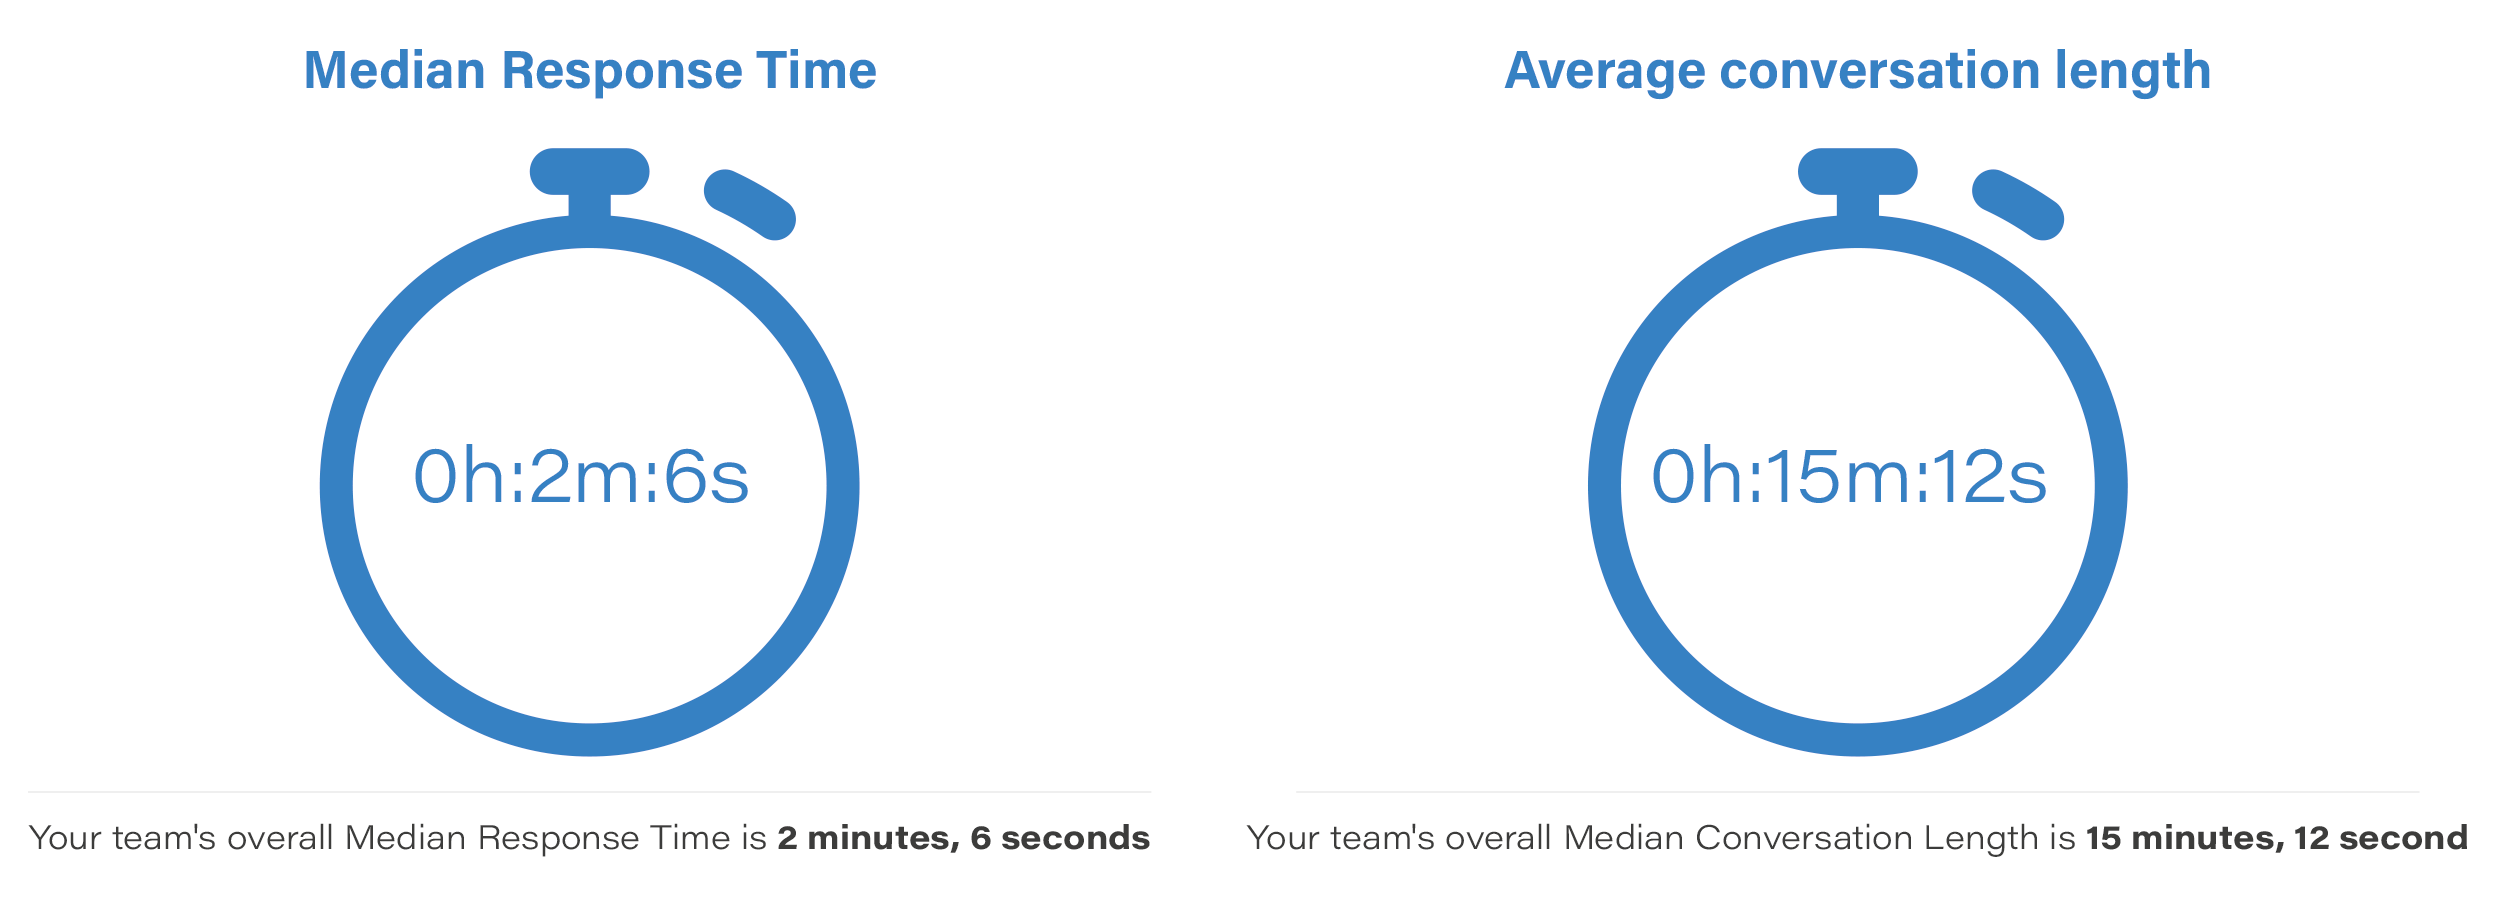
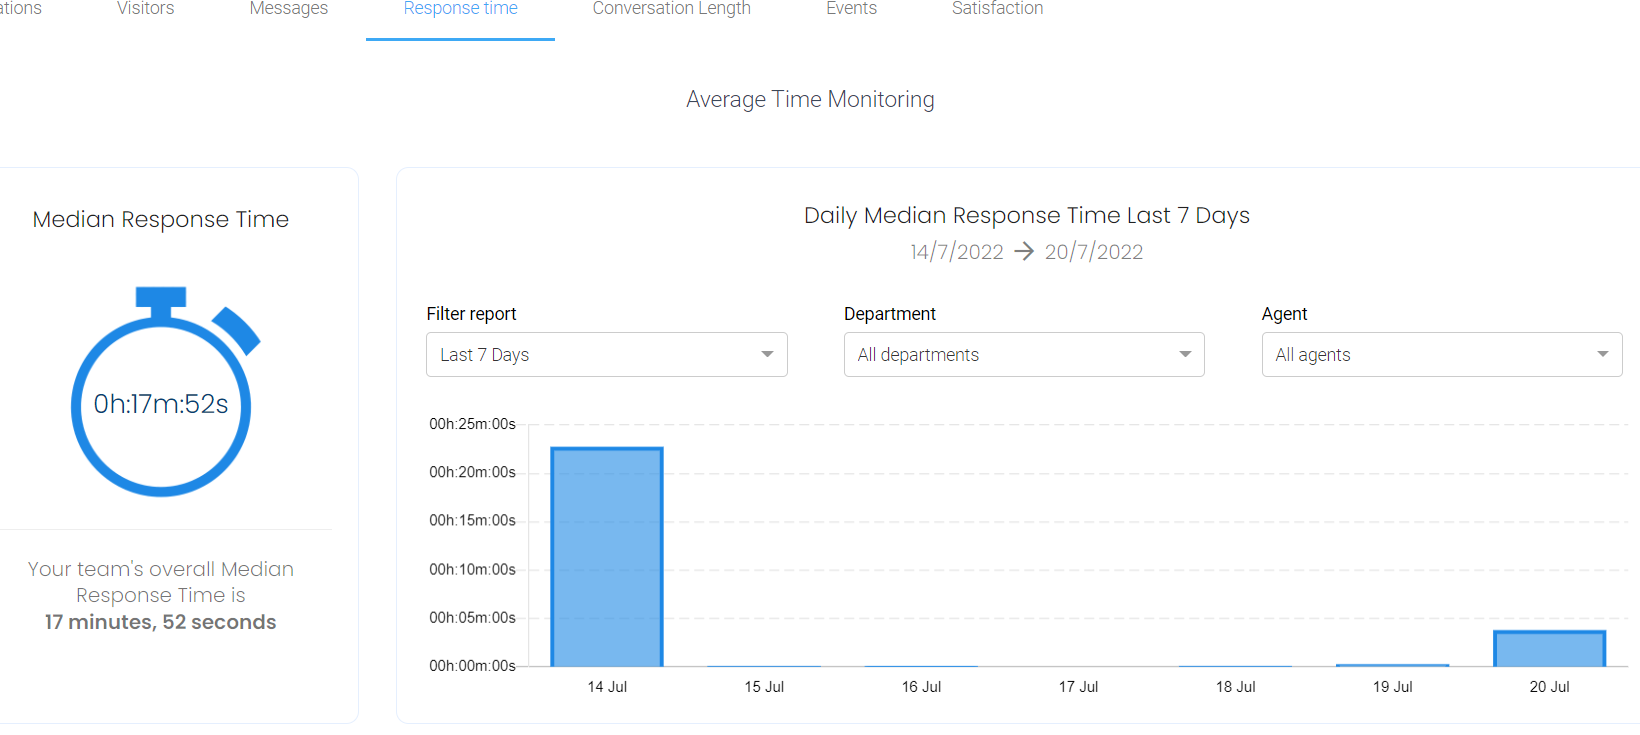
Median Response Time & Average conversation length. Finally, at the end of the Overview section, you'll see what is the median response time of your agents, once they've been contacted by a client as well as how much time was needed in average to close (or Resolve, as we call it) a client conversation. This is particularly useful if it appears that you ought to improve your agents' responsiveness. PRO TIP: to decrease the average conversation length, don't forget to Resolve (archive) your client conversations as soon as they come to an end.
Metrics
The second tab, Metrics, gives you seven different sub-sections, as follows.
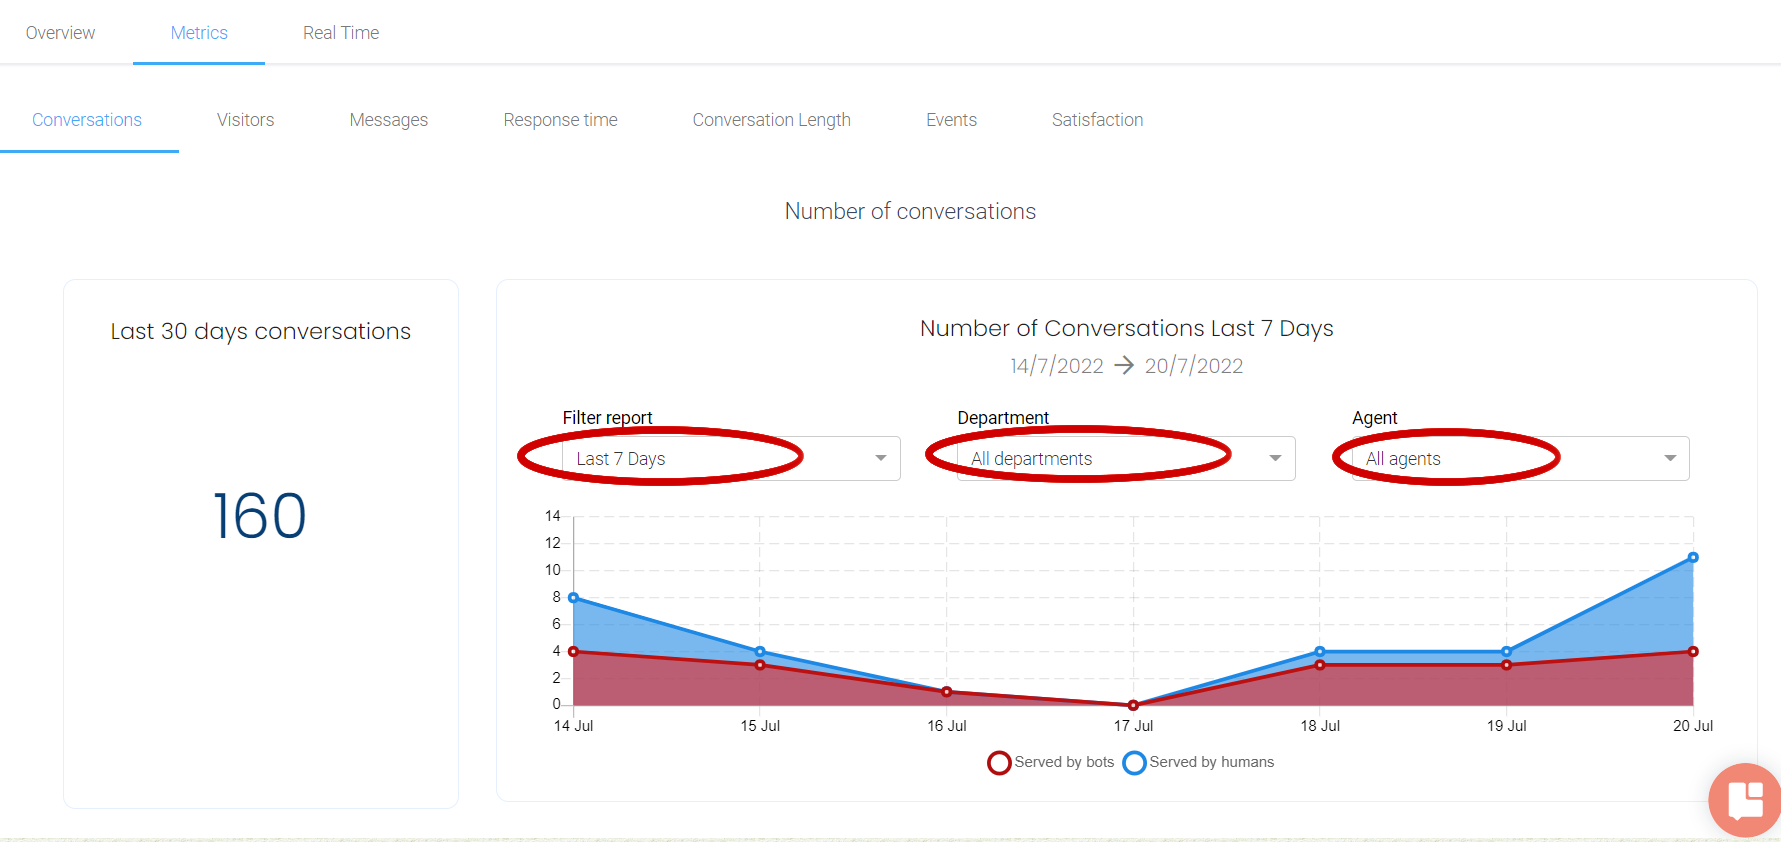
Conversations. The below graph has a twofold purpose: blue bits show conversations handled by your agents, whereas the portions in red identify client conversations managed by your chatbots. As you can see, during the weekend of the 16th-17th July, mainly the chatbots were the ones to handle chats with clients.
Moreover, you can easily filter your conversations in the last 7 days/15 days/30 days/3 months/6months/1 year. Departments, such as Sales or Support, can also be filtered, together with all of your agents or a single individual agent. These metrics will clearly show who is your busiest agent and/or department as well as your most effective chatbot
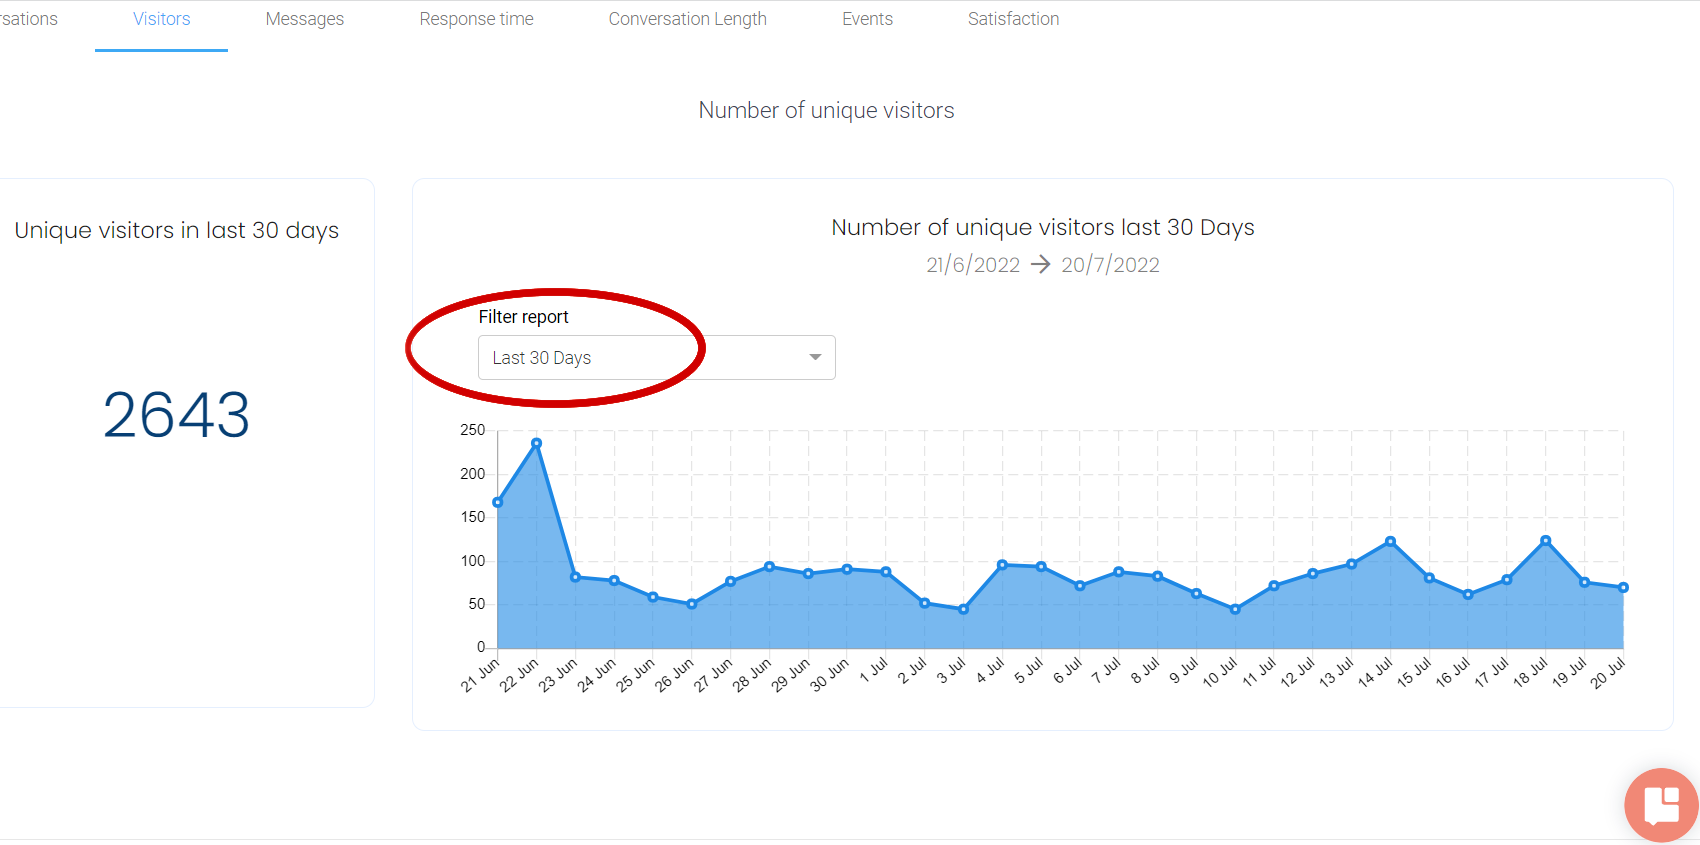
Visitors. Importantly enough, you'd want to know what amount of traffic you've been generating; again, you can easily filter your visitors in the last 7 days/15 days/30 days/3 months/6months/1 year. This feature is paramount in understanding if you're heading in the right direction business-wise, so use it profusely.
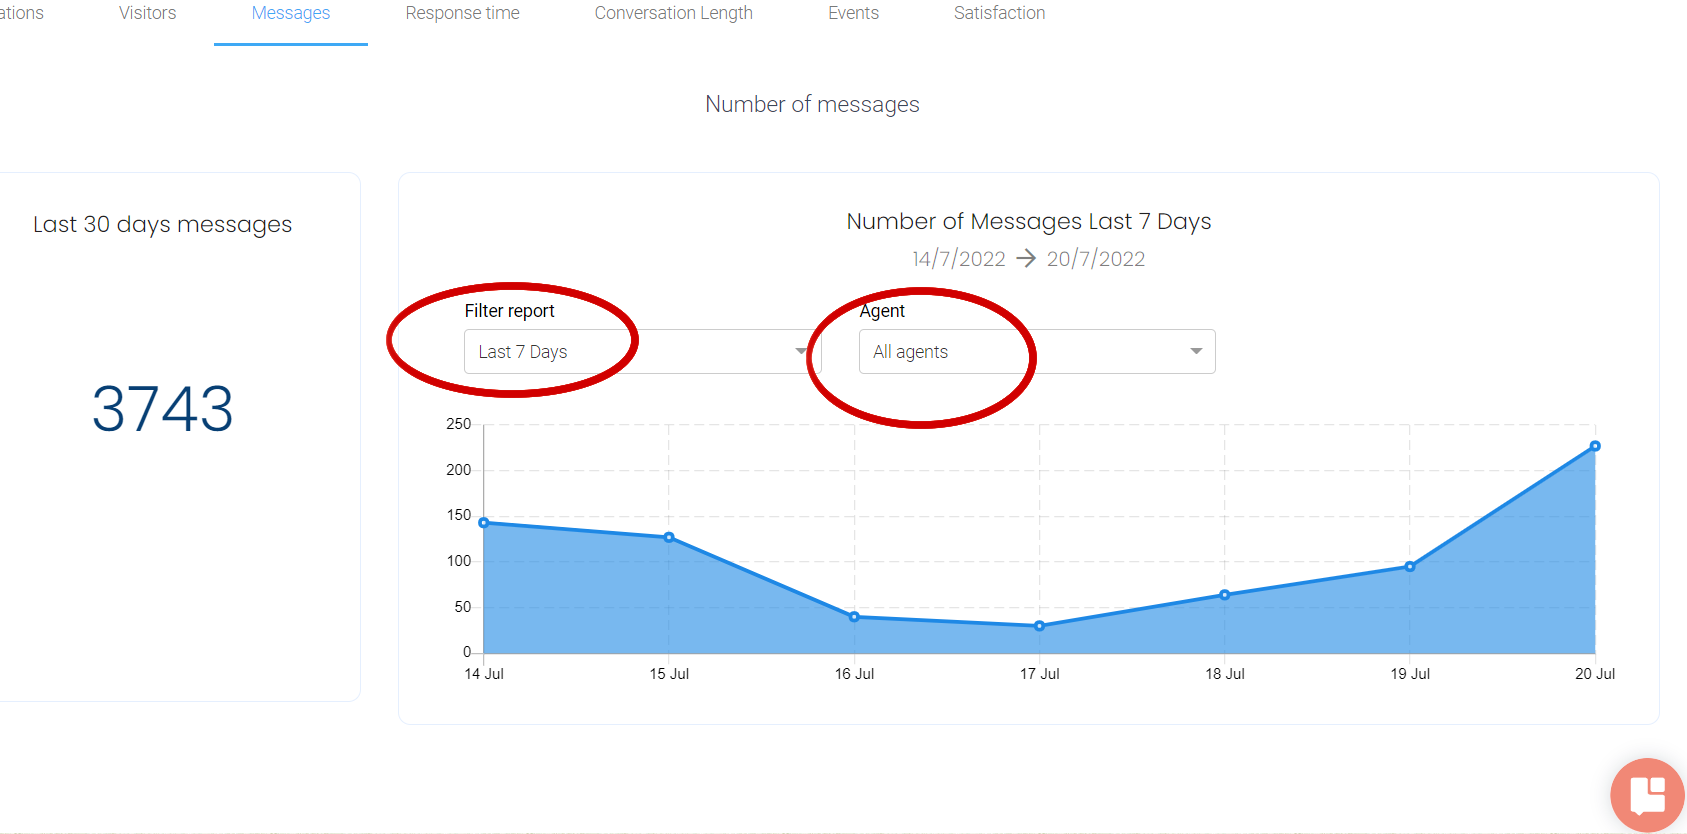
Messages. Here you can easily filter the messages received in the last 7 days/15 days/30 days/3 months/6months/1 year. Moreover, you can filter your agents (all of them or a specific agent) to see how many messages they've exchanged in a given period of time.
Response time. Here you can see in more detail what've seen above in the Overview section. All of the above mentioned filters are available here, too.
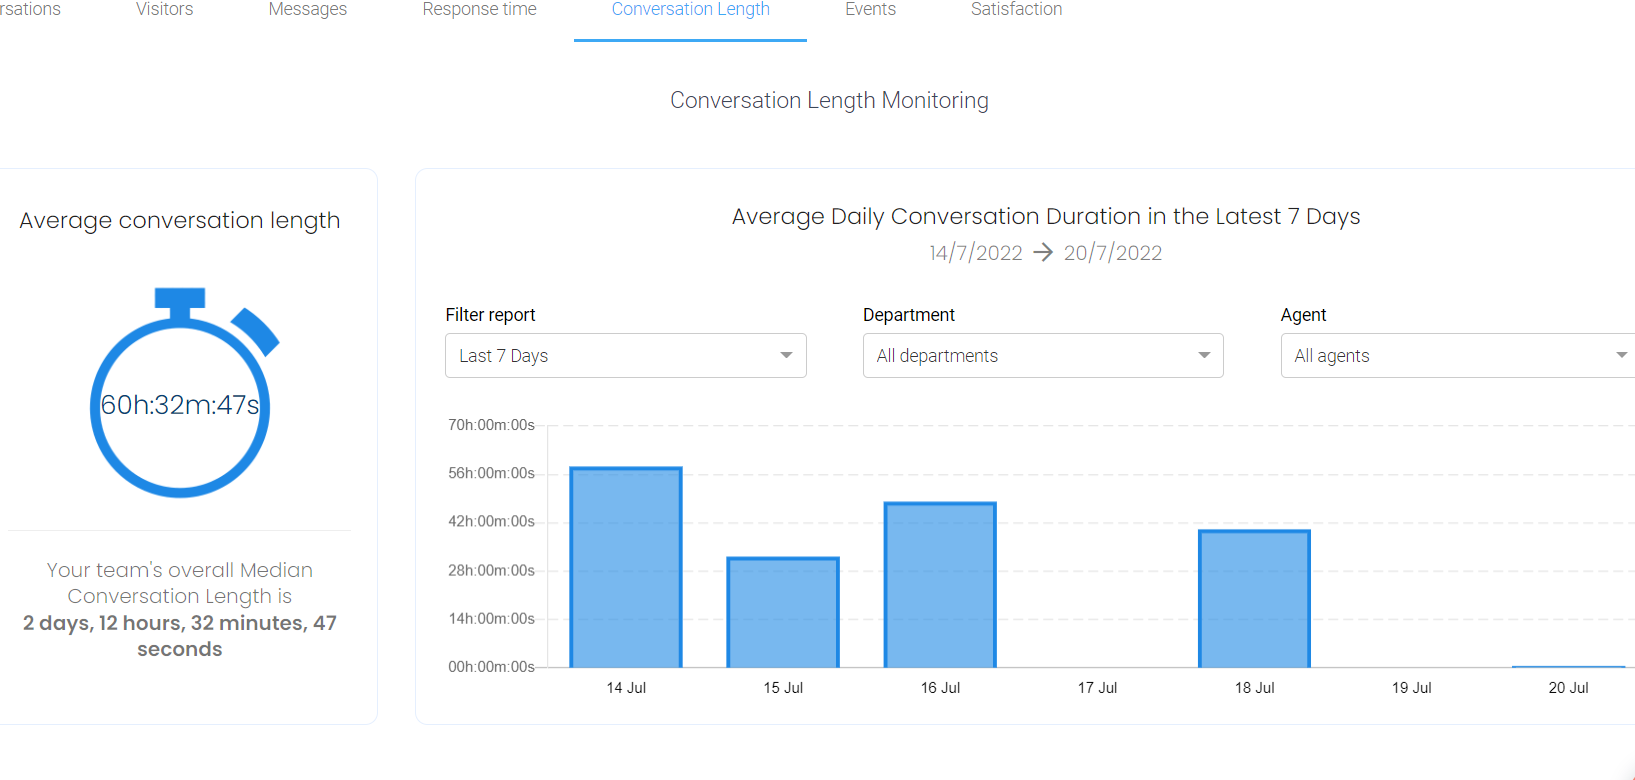
Conversation length. Here you can see in more detail what've seen above in the Overview section. All of the above mentioned filters are available here, too.
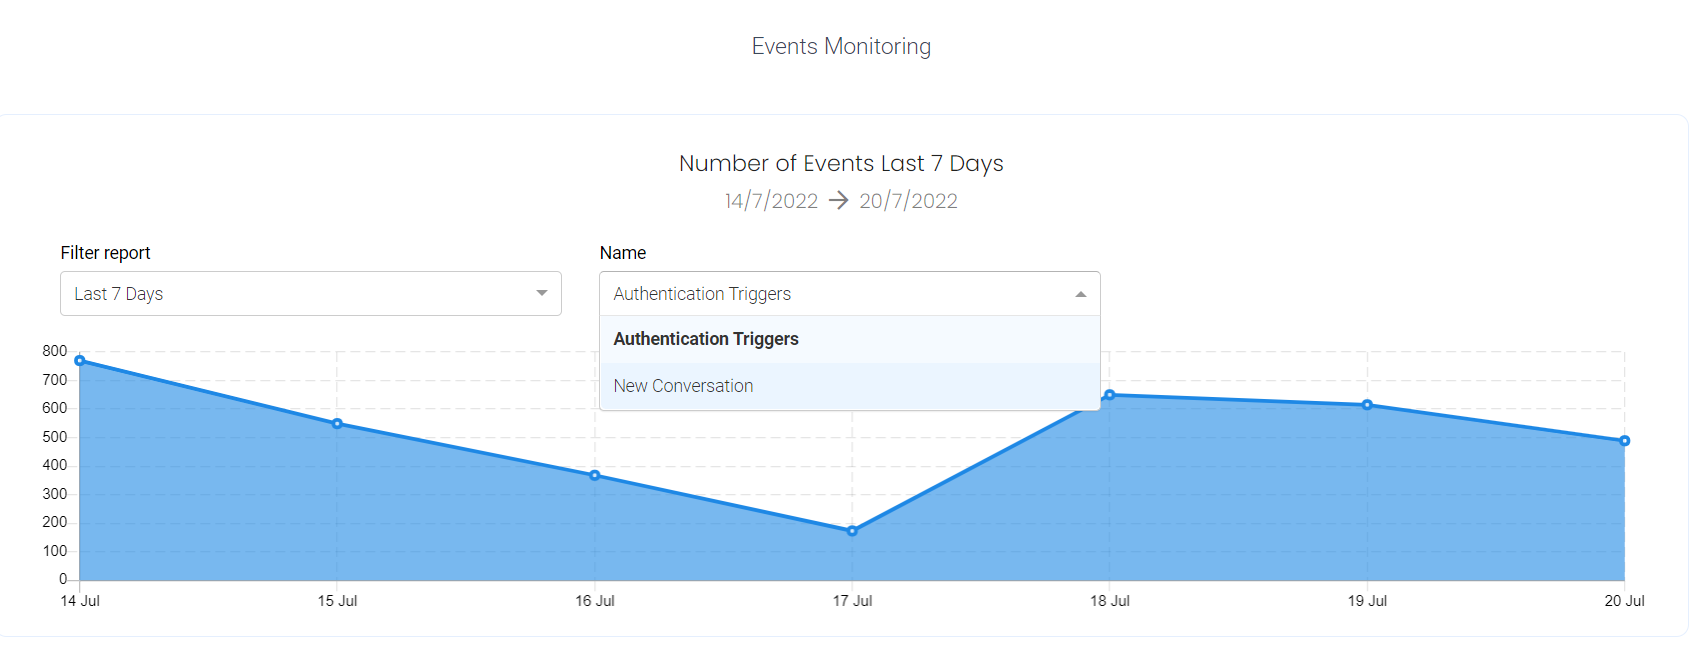
Events. This section is a bit more technical in that it provides the amount of times the user has been authenticated while using your website, if you choose the Authentication Triggers filter (check our JWT Custom Authentication tutorial). Or simply put, how many times you've had a user visit single pages of your website in last 7 days/15 days/30 days/3 months/6months/1 year. It also shows, if you pick the New Conversation filter, how many times users have initiated a new conversation with you through Tiledesk widget.
This means that you can extract the number of times a user has clicked on the New Conversation button and received the Welcome message from the chatbot BUT hasn't continued said conversation. To check how many conversations the user has engaged in, on the other hand, you'll need to check the Conversations tab in Metrics, as seen above.
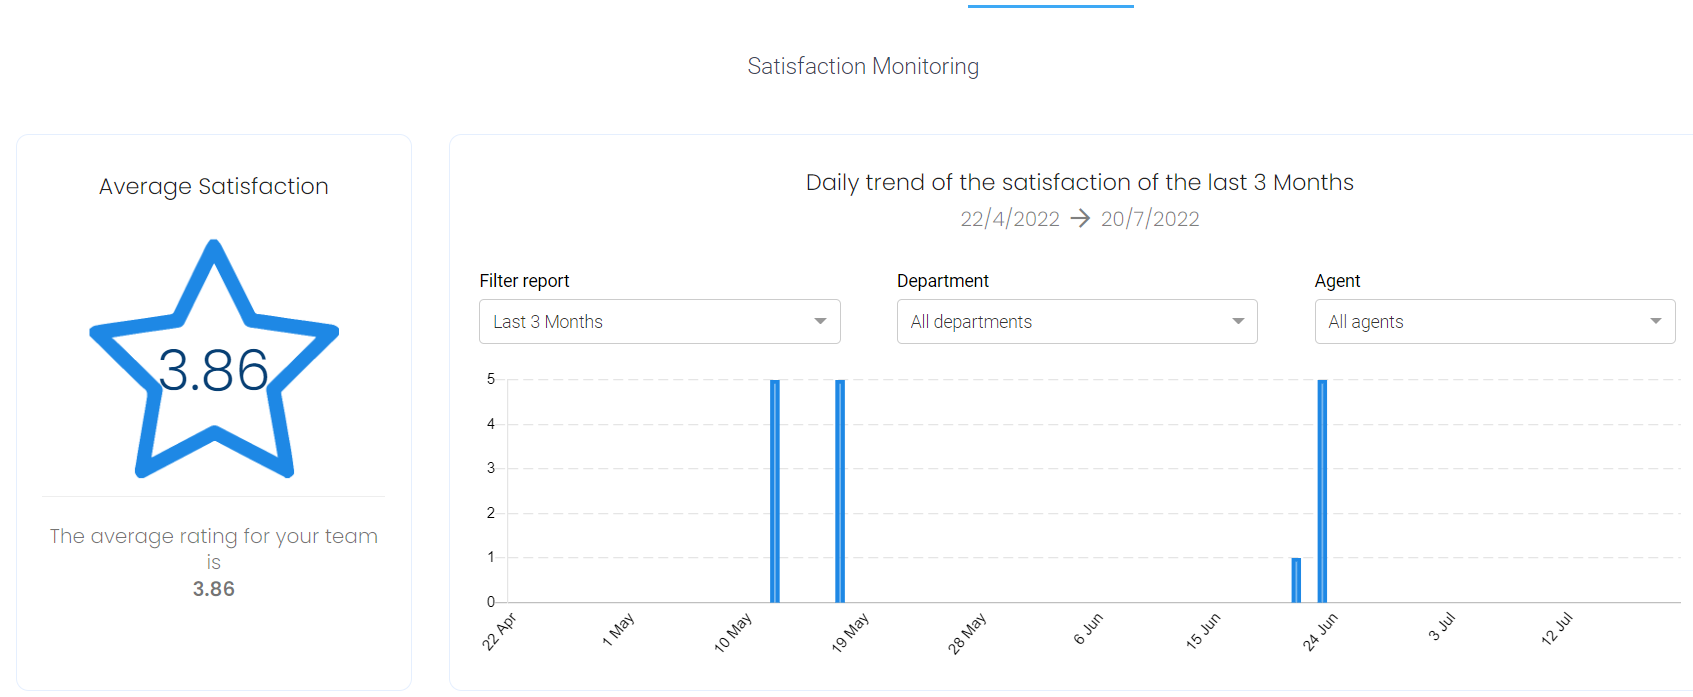
Satisfaction. Lastly and importantly, you can monitor your client satisfaction rate in reference to a specific period of time as well as department and specific agents. A great way to keep an eye on your customer satisfaction, which is vital for any entrepreneur.
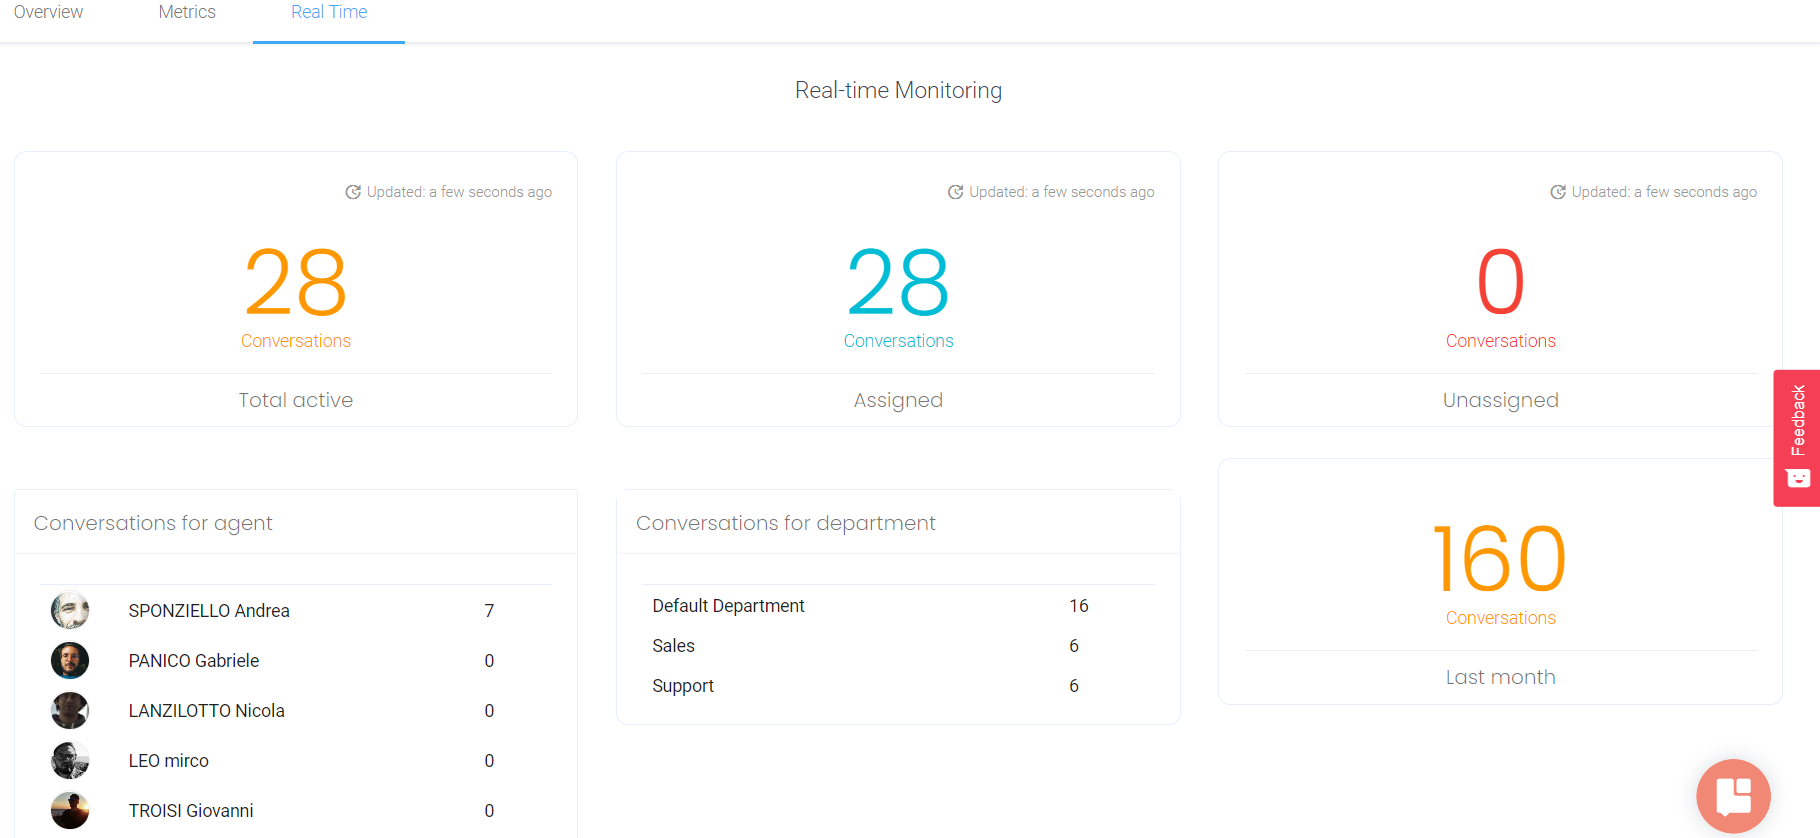
Real Time
The final section gives you a quick snapshot of everything you need to know is happening in real time (updated to a second):
- total active conversations
- assigned conversations (managed by your operators, that is)
- unassigned conversations that are yet to be overtaken by one of your operators
It also shows a total number of conversations per department, so that you can see, for example, which department may need manning or downscaling. Each agent will also have a number of active conversations they've been managing next to their name.
That's it - if you've come this far, it means you've passed our Analytics 101 fiercely!
For any feedback or issue, feel free to write at info@tiledesk.com
For more info on who we are, what we do, or what our shtick is, visit Tiledesk.com 👩🚀